E-commerce Profit Tracking: Expenses, COGS and Net Margin Explained
E-commerce profit tracking is the discipline that separates stores that survive from stores that merely look busy. Revenue feels great on the dashboard, but it is a vanity metric: it tells you how much money moved
through
your business, not how much stayed
in
it. If you sell PKR 2,000,000 in a month and keep PKR 40,000, you have a 2% net margin and almost no room for error. This guide explains the numbers that actually decide whether your store is healthy — COGS, gross margin, operating expenses, and net margin — and shows how to track them per order, especially in cash-on-delivery (COD) markets where returns and shipping silently eat your profit.
Why revenue is a vanity metric
Top-line sales hide everything that matters. Two stores can post identical revenue while one is profitable and the other is quietly going broke. The difference lives in the costs underneath each sale: what the product cost, what it cost to ship, what you paid to acquire the customer, and how often parcels come back unsold.
Profit tracking forces you to answer a sharper question than "how much did we sell?" — it asks "how much did we keep, and on which products and channels?" That answer changes what you advertise, what you stock, and what you stop selling entirely.
The vocabulary: COGS, gross margin, operating expenses, net margin
Four definitions do most of the work. Get these straight and the rest of profit tracking follows.
COGS (Cost of Goods Sold)
The direct cost of the products you sold — your supplier/manufacturing price per unit, plus inbound freight and import duties to get stock into your warehouse. COGS is the single biggest input to profit, and most stores estimate it instead of recording it. Pulling COGS from real purchase orders and supplier records is the only way to keep it accurate as supplier prices drift.
Gross margin
Revenue minus COGS, expressed as a percentage of revenue. Gross margin tells you how much each sale contributes before overhead. A 40% gross margin sounds comfortable until shipping, COD fees, and returns are deducted.
Operating expenses
Everything it costs to run the business that isn't the product itself: ad spend, salaries, rent, software subscriptions, packaging, transaction fees. Many of these are recurring expenses that hit every single month whether you sell or not.
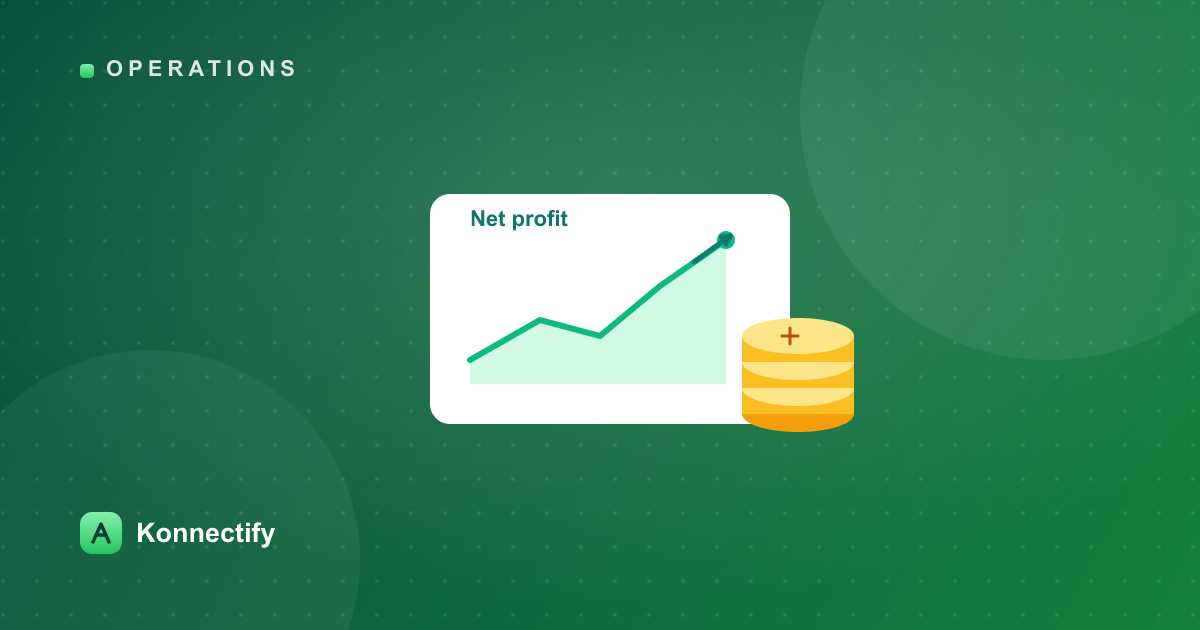
Net margin
What's left after all costs. This is the number that pays you. The formula is simple to state and brutal to ignore:
Net Profit = Revenue − COGS − Shipping − COD Fees − RTO/Return Cost − Packaging − Ad Spend − Transaction Fees − Operating Overhead
Net Margin % = (Net Profit ÷ Revenue) × 100
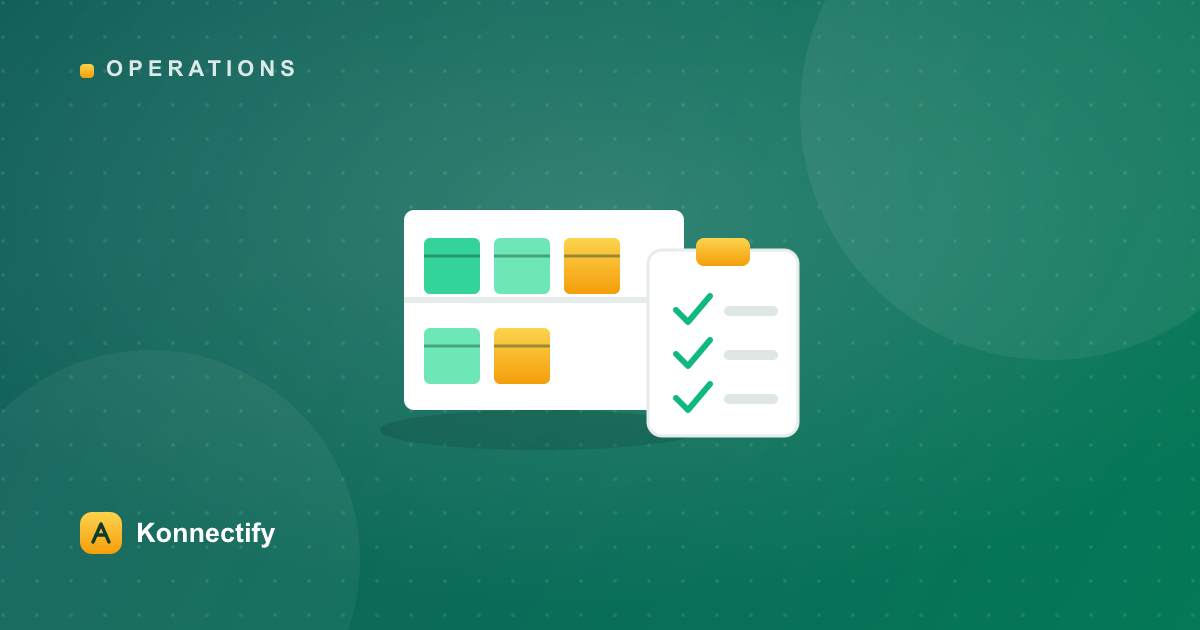
The full list of costs to track
You cannot calculate net margin from costs you never recorded. Here is the complete checklist most stores need:
- Product cost (COGS) — per-unit purchase price from suppliers, ideally from purchase orders.
- Inbound freight & duties — getting stock to you.
- Outbound shipping — courier charges per parcel (PostEx, Leopards, etc.).
- COD fees — the percentage couriers charge to collect cash on your behalf.
- RTO / return cost — return-to-origin shipping plus the labor and damage cost of refused parcels.
- Packaging — boxes, flyers, tape, inserts, fragile wrap.
- Ad spend — Meta, Google, influencer and affiliate payouts. Tie this back to revenue with proper ROAS tracking across Shopify and WooCommerce.
- Transaction / gateway fees — on prepaid card and wallet orders.
- Recurring overhead — salaries, rent, utilities, software/SaaS subscriptions, accounting fees.
The first six are largely variable (they scale with orders); the last group is fixed/recurring. Both must be allocated against revenue to find true net margin.
Per-order profitability — and why COD markets must account for RTO
Averages lie. A store can be profitable overall while bleeding money on its best-selling SKU or its most-advertised campaign. Calculating profit per order (and rolling it up by product, channel, and city) is where the real decisions get made.
In COD-heavy markets like Pakistan, the silent killer is RTO — return to origin. When a customer refuses delivery or is unreachable, you still pay forward shipping, often return shipping, and you've tied up stock and cash with zero revenue. If 25% of COD orders come back, every delivered order has to absorb the loss of the ones that didn't. Ignore RTO and your "profitable" margins are fiction.
RTO allocation rule of thumb: divide your total monthly RTO/return cost by the number of successfully delivered orders, and subtract that figure from each delivered order's profit.
A worked example: one COD order
Here's a single delivered order priced at PKR 3,000, with realistic Pakistani COD economics:
| Line itemAmount (PKR) | |
| Revenue (order value) | +3,000 |
| COGS (product cost) | −1,200 |
| Outbound shipping | −250 |
| COD collection fee (~2%) | −60 |
| RTO allocation (per delivered order) | −180 |
| Packaging | −40 |
| Ad cost (per acquired order) | −500 |
| Net profit | +770 |
Gross margin here looks like a healthy 60% (PKR 1,800 after COGS). But after shipping, COD fees, RTO allocation, packaging, and ads, the real net profit is PKR 770 — a 25.7% net margin. Now imagine ad cost creeps to PKR 900 or RTO allocation doubles: this order flips from a winner to a near break-even. That's the kind of insight you only get from disciplined e-commerce profit tracking, not from staring at revenue.
How to track profit consistently (not once a quarter)
Profit tracking only works if it's continuous. A quarterly spreadsheet reconstruction is too late — by the time you find the leak, you've already scaled the wrong campaign for three months. Build a steady rhythm instead:
- Record COGS at the source. Capture per-unit cost on every purchase order so it flows automatically into each sale.
- Log every expense as it happens, and flag the recurring ones (rent, salaries, software) so they're never forgotten.
- Pull ad spend in automatically from your ad platforms rather than typing totals from memory.
- Reconcile COD and RTO weekly against courier remittances so returns are counted, not assumed away.
- Review net margin by product and channel monthly and cut or reprice the losers.
The hard part is doing this across multiple stores and channels without a dozen spreadsheets.
How Konnectify turns orders into profit and net-margin reports
This is exactly the gap Konnectify is built to close. Because it runs your Shopify and WooCommerce stores from one dashboard, it can connect the dots that usually live in separate tools:
- Unified orders from every store feed a single profit view.
- COGS flows from Purchase Orders & Suppliers, so product cost is real, not guessed.
- Couriers & Shipments (PostEx, Leopards, COD) record shipping, COD fees, and RTO outcomes per order.
- Marketing pulls in Meta ad spend and ROAS so acquisition cost lands against the right orders.
- Expenses capture packaging, salaries, rent, and software — including recurring expenses.
All of it rolls up into Konnectify's Reports module as sales, profit, COGS, and net-margin figures — so you can finally see net margin per order, product, and channel without rebuilding a spreadsheet every month.
Frequently asked questions
What's the difference between gross margin and net margin?
Gross margin is revenue minus COGS only — what each sale contributes before overhead. Net margin subtracts everything else: shipping, COD fees, RTO, packaging, ads, transaction fees, and recurring overhead. A strong gross margin can still produce a tiny or negative net margin once those costs are included, which is why net margin is the number that matters.
How do I account for RTO in profit tracking?
Total your monthly RTO and return costs (forward shipping, return shipping, damaged stock, labor) and divide by the number of successfully delivered orders. Subtract that per-order figure from each delivered order's profit. In COD markets this allocation often makes the difference between a real profit and a loss you didn't notice.
Why is revenue considered a vanity metric?
Revenue measures money moving through your store, not money you keep. Two stores with identical revenue can have wildly different profits depending on COGS, shipping, returns, and ad spend. Decisions based on revenue alone often scale the unprofitable campaigns and products fastest.
How often should I review my net margin?
Track costs continuously and review net margin by product and channel at least monthly — weekly for COD reconciliation. Quarterly reviews catch problems far too late to act on. A tool like Konnectify keeps the data current so the review is a quick read, not a rebuild.
Ready to see real profit instead of vanity revenue? Konnectify ties your orders, COGS, shipping, ad spend, and expenses into clear net-margin reports across all your stores. Start free and find out which orders actually make you money.
Sara Malik
E-commerce Operations
Sara writes about inventory, POS, profitability and the day-to-day operations of running a growing online store on Konnectify.
Run your stores from one dashboard
Unify Shopify, WooCommerce, WhatsApp & POS — confirm COD on WhatsApp, book couriers and track everything in one place.
Related articles
May 17, 2026
Inventory and Purchase Order Management for Growing Online Stores
Why inventory breaks as you scale and how to fix it: the supplier-to-PO-to-receive-to-sync flow, reo...
May 13, 2026
POS + Online Store: How to Unify In-Store and E-commerce Sales
Running a shop and an online store as two silos causes overselling, double stock counts, and fragmen...